Annals of Systems Biology
Combined Application Strategy of Biochar/Phosphate Fertilizer Affects the rice Production by Regulating Soil Bacteria Taxa Composition
Yutao Li1,2, Yu Cheng3,4 and Hui Liu1*
1College of Arts and Science, Northeast Agricultural University, Harbin, China
2Heilongjiang River Fisheries Research Institute, Chinese Academy of Fishery Sciences, Harbin, China
3College of Life Science, Northeast Agricultural University, Harbin, China
4Jiamusi No.2 Senior School, Jiamusi, China
Cite this as
Li Y, Cheng Y, Liu H. Combined Application Strategy of Biochar/Phosphate Fertilizer Affects the rice Production by Regulating Soil Bacteria Taxa Composition. Ann Syst Biol. 2024;7(1): 035-050. Available from: 10.17352/asb.000022Copyright License
© 2024 Li Y, et al. This is an open-access article distributed under the terms of the Creative Commons Attribution License, which permits unrestricted use, distribution, and reproduction in any medium, provided the original author and source are credited.Phosphate fertilizer affects the rice yield and has a critical role in arable land management. Biochar regulates soil nutrient and soil microbe taxa composition. Our study aimed to elucidate the effects of co-application for biochar-phosphate on soil nutrient indicators, soil microorganisms, and crop production. Our experiment was set up as follows: 0 t/hm2, 28 t/hm2, and 55 t/hm2 biochar application rates with 20 kg/hm2, 40 kg/hm2, and 60 kg/hm2 phosphate fertilizer. The rice yield and soil nutrient indexes were observed and the differences between groups were analyzed based on multiple comparisons. 16S ribosomal DNA sequencing was used to analyze the soil bacteria structure. Redundancy analysis was performed to obtain the correlation relationships between microbial community marker species, soil nutrient indexes, and rice yield. The results showed that a higher application rate of biochar led to a significant alteration in the soil water content, bulk density, alkali-hydrolyzed nitrogen, and available phosphate content. In addition, high concentrations of biochar-phosphate fertilizer application elevated the soil bacterial diversity. Biochar had various effects on the relative abundance of soil bacteria taxa. Our study provided a theoretical basis for exploring efficient fertilization strategies in the rice cultivation industry and shed light on the extensive biochar application in agriculture production.
Introduction
Soil ecosystems include microbes, mineral matter, organic matter, water, and air in soil. Soil microorganisms, which contain bacteria, fungi, actinomycetes, and protozoa, play roles in maintaining the normal circulation of materials and energy conversion in the ecosystem. Among them, soil bacteria dominated due to their enormous diversity [1]. It was estimated that there were 2,000 and 8.3 million bacteria in 1 g of soil, and only 1% of the microbiome can be observed under a microscope [2]. Microorganisms taxa were related to the soil physiological processes and played important roles in the accumulation, fixation, and movement of soil nutrients and the biotransformation of organic pollutants [3]. Additionally, soil microbes directly (indirectly) participated in the biochemical mechanisms of soil nutrient conversion, biological control, carbon pool stabilization, and aggregate formation [4]. Because soil microorganisms are sensitive to environmental changes, it could be used as one critical index to evaluate soil quality and fertility [5].
Biochar has been widely applied as a soil amendment in agriculture recently. It is one highly aromatic solid substance formed by pyrolysis of biomass at high temperature (700 ℃) under the condition of hypoxia [6]. Biochar has the characteristics of a large specific surface area, good porosity structure, high carbon content, and strong adsorption capacity, so it can be used to improve soil structure and increase soil nutrient content [7]. Biochar provides a large amount of nutrients and a suitable living environment for soil microorganisms, which could affect the soil’s bacterial diversity and improve the microbial community structure. The micro-pore structure of biochar could avoid the struggle within microbial species, thus playing a protective role for beneficial microorganisms in the soil [8]. Biochar contains carbon and nitrogen sources that are easily decomposed and beneficial to the survival of microorganisms, which is also the reason for the high activity and quantity of microorganisms in the early stage of biochar application in soil [9]. Some studies have shown that the application of biochar in soil could improve the biomass and activity of microorganisms, and the microbial community structure would not be changed due to the long-term application of biochar [10]. Existing studies have shown that biochar promotes the electron transfer between bacteria and heavy metals, which promotes the transformation of heavy metals and reduces the toxicity of heavy metals to soil microorganisms [11]. Phosphorus fertilizer has critical roles in the soil micro-ecosystem homeostasis and affects the crop yield directly. Soil microbes taxa would be regulated by the application mode of phosphorus fertilizer. Reduced application of phosphorus fertilizer in paddy soil significantly altered the soil microbial community structure [12]. The application of reduced phosphate fertilizer did not change the activity of soil phosphatase but significantly affected the structure and relative abundance of the soil microbial community. Long-term phosphate deficiency induced the increased trend of microbial population to activate soil nutrients, and sufficient phosphate fertilizer could maintain the dynamic balance of microbial community structure. Biochar that was combined with phosphorus fertilizer could improve the soil nutrients and increase the relative abundance of soil microbial species, but the improvement effect of oxidized biochar on soil nutrient components and microorganisms would be significantly reduced. The interaction between biochar and phosphate fertilizer affected the diversity and abundance of the soil microbial community by influencing soil pH [13].
At present, most studies on the effects of biochar and phosphate fertilizer on soil bacteria composition only focused on a single factor, but there were a few studies on the effects of the combined application of biochar and phosphate fertilizer on soil bacteria taxa composition. Therefore, this study took the black soil from Northeast China as the test sample and adopted a pot experiment to study the best strategy of combination application for biochar and phosphate fertilizer on soil bacteria under controlled irrigation conditions, aiming to provide the scientific basis and technical support for improving soil quality and microbial environment in the black soil region of Northeast China.
Materials and methods
Experimental site information
The present test was conducted from June to August 2021 at the Comprehensive Test Site of the College of Water Conservancy and Civil Engineering, Northeast Agricultural University (126°45 ‘32 “E, 45°44’ 41” N). The test area belonged to the temperate continental monsoon climate with an altitude of 145-175 m. The annual average temperature is about 3.6 ℃, the highest monthly average temperature in summer is about 28 ℃, the lowest monthly average temperature in winter is about -24 ℃, the annual sunshine time is 2460-2786 h, and the solar rate is 61%. The annual average relative humidity is greater than 68%, the annual average evaporation is about 1500 mm, and the annual frost-free period is about 145 d.
Experimental materials
The soil tested was black loam, and its basic physical and chemical properties are presented in Table 1. The biochar used for the test was purchased from Liaoning Jinhefu Development Co., LTD. The raw material was corn straw and fired under anaerobic conditions at 450 ℃. Its physical and chemical properties are presented in Table 2. The chemical fertilizers used were urea (N mass fraction of 46%), diammonium phosphate (N mass fraction of 15%, P2O5 mass fraction of 42%), and potassium chloride (K2O mass fraction of 60%). The rice plant used for the present investigation was selected as the Longqing No.5.
Experimental design
The tests were carried out in a mobile awning at the test site. The test basin was 34 cm in diameter and 43 cm in depth, and the bottom of the basin was sealed. The soil was naturally air-dried and broken and then sifted. Each basin was filled with 10 kg of dry soil. After evenly mixing the biochar and soil, the basin was deposited for one week. The experiment was set up with two factors, biochar and phosphate fertilizer, among which three levels of biochar dosage were designed, respectively 0 t/hm2, 28 t/hm2, and 55 t/hm2. Three levels of phosphorus fertilizer (P2O5) were also designed (20 kg/hm2, 40 kg/hm2, and 60 kg/hm2, respectively). Nine combined treatment groups and one control group (CK, no biochar, and phosphate fertilizer were added) were set, and each group was repeated three times (n = 3). The amount of biochar and chemical fertilizer for each treatment is shown in Table 3. Phosphorus fertilizer was applied as base fertilizer, nitrogen fertilizer was applied four times according to base fertilizer: tillering fertilizer: promoting flower fertilizer: keeping flower fertilizer = 4.5:2:1.5:2, and potassium fertilizer was applied two times according to base fertilizer: ear fertilizer = 1:1. The rice planting method was dry seeding, with 6 holes per pot, and the irrigation method was controlled irrigation. The water management at different growth stages is shown in Table 4. When the soil water content reached the lower limit of the water control standard, the irrigation would reach the upper limit of the water control strategy.
Physical and chemical properties of soil samples
The ring knife method was used to measure the soil bulk density. Soil porosity = (1-bulk density/density)×100%, soil density value was 2.65g /cm3; The moisture content of the soil was measured by drying method. The content of soil total nitrogen was determined by the elemental analyzer. The content of total phosphorus in soil was determined by the molybdenum-antimony resistance colorimetric method. The content of total potassium in soil was determined by inductively coupled plasma mass spectrometry. The content of available phosphorus was determined by NaHCO3 extraction spectrophotometer. The content of soil organic matter was determined by the potassium dichromate volumetric method and external heating method. The pH content of the soil was measured by pH meter (soil to water ratio=2.5:1). The content of soil alkali-hydrolyzed nitrogen was determined by diffusion method. The content of available potassium in the soil was determined by the cold HNO3 nitric acid leaching and flame photometer.
High-throughput sequencing analysis for soil microbe
Each soil sample (n = 3 per group) was thoroughly mixed, and the total DNA of the microbiome was extracted by the hexadecyl trimethyl ammonium Bromide (CTAB) method. The quality of DNA products was detected by 1% agarose gel electrophoresis, and the DNA concentration was quantitatively detected by an ultraviolet spectrophotometer. PCR amplification of V3-V4 variable regions of microbial genome was performed using commercial-specific primers 341F (5’ -CCTACGGGNGGCWGCAG-3’) and 805R (5’-GACTACHVGGGTATCTAATCC-3’). A total of 25 μL PCR system included 12.5 μL 2* Master Mix, 2.5 μL forward primer, 2.5 μL reverse primer, 50 ng template DNA, and double distilled water. PCR amplification project was performed as follows: 98 ℃ for 35 s; [98 ℃ for 10 s, 55 ℃ for 35 s and 72 ℃ for 45 s], last for 35 cycles; 72 ℃ for 15 min and then cooled to 4 ℃. PCR products were purified by AMPure XT beads (Beckman Coulter Genomics, Danvers, MA, USA) and quantified by Qubit (Invitrogen, USA). PCR amplification products were detected by 2% agarose gel electrophoresis using an AMPure XT beads recovery kit. Purified PCR products were evaluated using the Agilent 2100 Bioanalyzer (Agilent, USA) and Illumina library quantification kit with qualified library concentrations above 2nM. The qualified sequencing libraries were diluted by gradient, mixed in proportion according to the required sequencing pool size, and denatured into single strands by NaOH for on-machine sequencing. The NovaSeq 6000 sequencer was used for 2×250bp paired-ends sequencing. The raw data obtained by sequencing were separated according to barcode information, and the joint and barcode sequences were removed. DADA2 was performed for length filtering and denoising. Based on the Amplicon Sequence Variant (ASV) feature sequence files, the SILVA (Release 138) database was used for the species annotation (confidence threshold=0.7).
Data processing and statistical analysis
SPSS 25.0 software was used for variance analysis and multiple comparisons (least significant difference method). OriginPro 2021 software was used for the visualization process of data, and the significance level was selected as 0.05. Principal Coordinate Analysis (PCoA) was done using R 4.2.2 based on Bray-Curtis distance to determine differences in bacterial communities in different groups, and a “vegan” package in R and similarity analysis were used to determine whether grouping tests had statistical sense. Linear Discriminant (LDA) effect size (LEfSe) analysis was performed on bacteria, and the species with LDA scores>3.0 and p < 0.05 were retained. The “psych” package in R 4.2.2 was used to conduct symbiotic network analysis of gation-level bacteria based on the Spearman correlation coefficient, and only species with strong correlation (|r|>0.8) and statistically significant correlation (p < 0.01) were retained. Visualization of symbiotic network analysis is performed using Gephi 0.9.2 for plotting and calculation of topological parameters. AMOS software in SPSS was used to fit the structural equation model. Statistical results were visualized using Origin 2019b and MS Office 2021 software.
For the statistical analysis of the microbiome sequencing data, the calculation formula and program scripts were referred to the standard bioinformatics analysis methods (run in the R package 4.0.4 environment) and were supported by the Omics Cloud platform (LIANCHUAN, China).
Results and discussion
Effects of combined application of biochar and phosphate fertilizer on soil physicochemical properties
As shown in Table 5, a low amount of biochar combined with phosphorus fertilizer could significantly increase soil water content (p < 0.05) and low-carbon combined with phosphorus fertilizer increased by 26.03% on average compared with CK group, and B2P3 treatment significantly increased by 32.73% compared with CK group (p < 0.05). Compared with the CK group, the soil bulk density of low biochar combined with phosphate fertilizer decreased by 10.79% on average. Under the condition of no biochar application, phosphate fertilizer decreased the soil pH value, and the application of biochar increased the soil pH value. The pH value under high carbon levels increased by 2.90% on average compared with the CK group. The organic matter content of low biochar combined with phosphate fertilizer increased by 14.29% on average compared with the CK group, and the organic matter content of the B2P2 treatment was significantly increased by 21.50% compared with the CK group (p < 0.05). The soil alkali-hydrolyzed nitrogen content in the B2P1 treatment was the highest, which was 3.37% higher than that in the CK group. Biochar combined with phosphate fertilizer significantly increased soil available phosphate content (p < 0.05). At high biochar levels, soil available phosphate content increased significantly with the increase of phosphate fertilizer (p < 0.05), and B3P3 treatment was significantly increased by 50.60% compared with the CK group (p < 0.05).
Data statistics and quality control for 16S rDNA sequencing
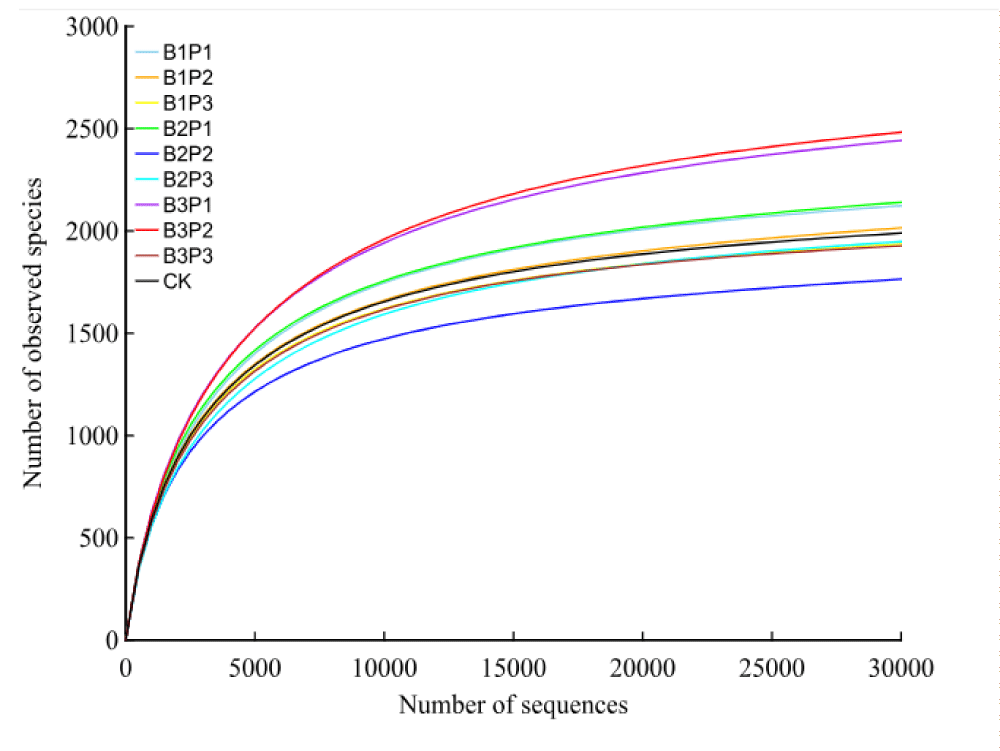
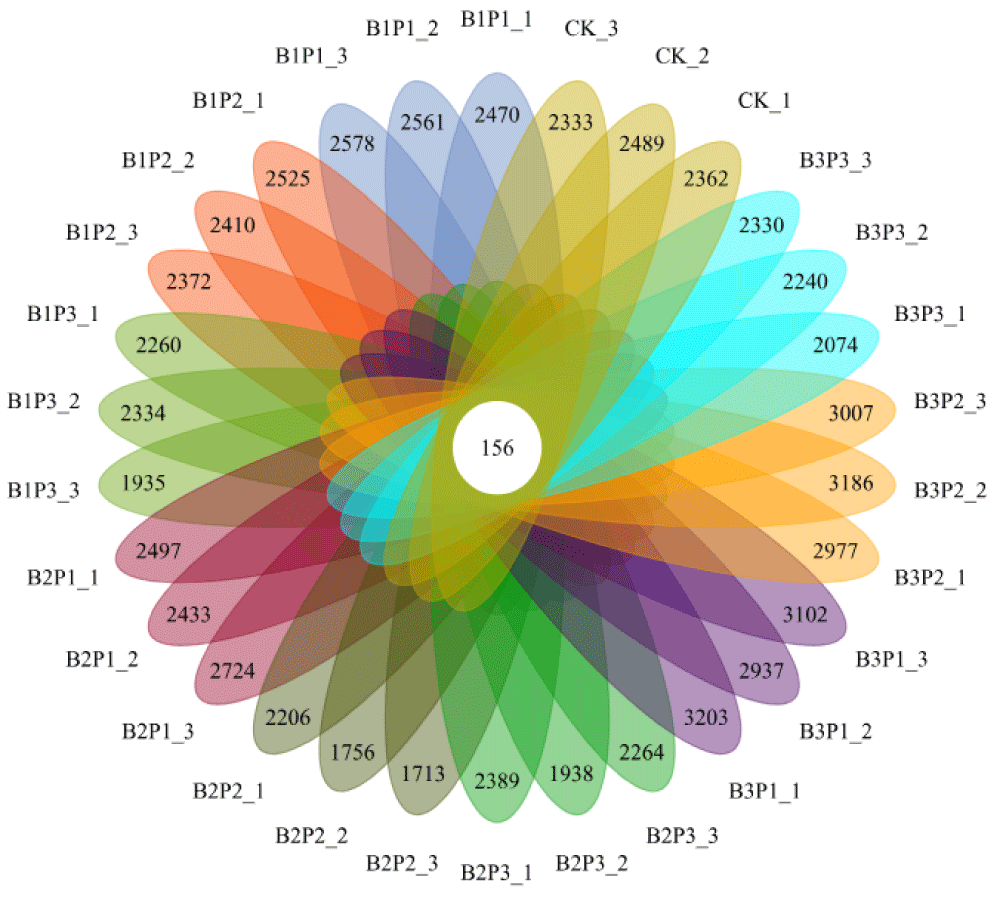
After quality control for raw tags (removing the barcode, primer sequence, part of the low-quality sequence, and chimera sequence), the final effective sequences (clean tags) were obtained for the subsequent data analysis. The statistical results of sequencing data are shown in Table 6. A total of 2503355 raw tags were obtained in the present sequencing project, of which 2171605 were valid, with an overall efficiency of 86.75%. In order to evaluate whether the amount of data sequenced was sufficient, a dilution curve based on the observed operational taxonomic units (OTUs) number was drawn, which could directly reflect whether the amount of sequencing data could cover all species in each sample (Figure 1). It could be ensured from the dilution curve that with the increase of sequence reads, the dilution curve tends to flatten out, indicating that the amount of sequencing data is reasonable and nearly all species in each sample have been identified. As shown in Figure 2, the total number of OTUs in all samples is 156. The average number of OTUs specific to B1P1, B1P2, B1P3, B2P2, B2P3, B3P1, B3P2, B3P3, and CK treatment were 2380, 2280, 2020, 2395, 1736, 2041, 2925, 2901, 2059 and 2239, respectively.
Effects of combined application of biochar and phosphate fertilizer on the diversity of soil bacteria
Table 7 shows the α diversity indexes in the soil bacteria community. Simpson index and Shannon index were used to evaluate the bacterial community diversity among different groups, while Chao1 index and ACE indexes were used to reflect the bacterial community richness. The Shannon indexes in B1P3, B2P2, B2P3, and B3P3 treatments were lower than those of the CK group. At the low and high carbon levels, the Shannon-Simpson indexes gradually decreased with the increased concentration of phosphorus fertilizer, but there was no significant difference between each treatment (p > 0.05). Compared with the CK group, Chao1 and ACE indexes in the B2P2 group were significantly lower (p < 0.05), while those in B3P1 and B3P2 treatment were significantly higher (p < 0.05).
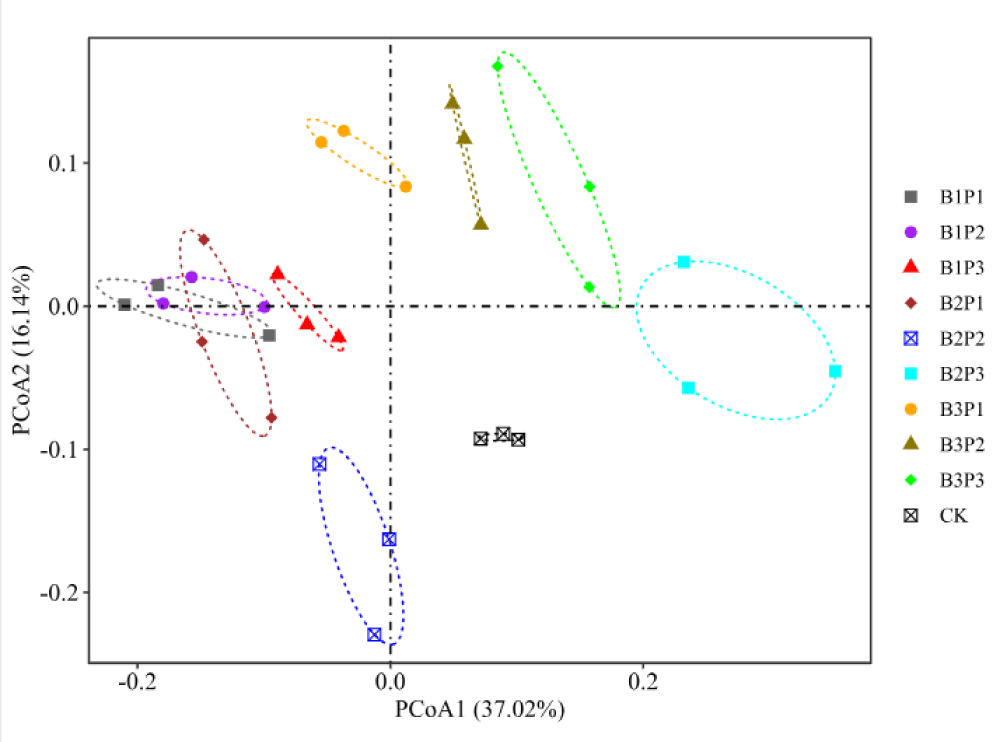
Figure 3 shows the Principal Coordinate Analysis (PCoA) for the soil microbe structure between four groups. The results showed that the PCoA1 axis and PCoA2 axis accounted for 37.02% and 16.14% of the total variation, respectively, and the cumulative contribution rate was 53.16%. There were significant differences in bacterial community structure between the CK group and biochar-phosphate fertilizer co-interaction groups, indicating that biochar-phosphate fertilizer co-application mode could significantly change soil bacterial community structure (R=0.8415, p < 0.05). The usage of single phosphate fertilizer was located on the left side of the axis. A low concentration of biochar combined with low/medium phosphate fertilizer was distributed on the left side, and the distance between them was relatively far. The treatment strategy of high carbon combined with medium/high phosphate fertilizer is distributed on the right side of the axis. The results showed that the bacterial community structure of soil was similar under the single application of phosphorus fertilizer, but the difference in bacterial community structure was changed after the combination of biochar and phosphorus fertilizer. As an important part of the soil system, soil microorganisms play an important role in the paddy field ecosystem by regulating the decomposition of soil organic matter and plant litter and the availability of plant nutrients. In this study, the application of appropriate phosphate fertilizer could improve the diversity of soil bacteria, while the application of excessive phosphate fertilizer can reduce the diversity and richness of soil bacteria. The reason was that the application of phosphorus fertilizer would increase the soil’s phosphorus content. On the one hand, it could directly provide phosphorus nutrients for soil microorganisms; on the other hand, it could promote plant growth and increase the secretion of nutrients in roots, thus improving the diversity of soil microorganisms by regulating their growth. The application of excessive phosphorus fertilizer decreased the soil N/P ratio, which led to the decreased trend of microbial biomass, and therefore decreased the α diversity of bacterial community. At present, it is generally believed that biochar could increase the diversity of the soil microbial community [14], thereby enhancing the stability and stress resistance of farmland ecosystems. In this study, compared to applying phosphorus fertilizer alone, adding biochar overall improved the diversity and richness of soil bacterial communities. According to a previous study, the interaction between biochar and fertilizer could significantly improve the diversity and richness of soil microbial communities [15]. Firstly, due to the high porosity of biochar, it provides a good habitat for soil microorganisms, which can protect bacterial communities from external environmental factors and increase the ecological niche of soil microorganisms. In addition, bacteria can also reproduce in the pores of biochar, ensuring the diversity and richness of microorganisms [16]. Secondly, in the manufacturing process of biochar, biomass raw materials can be transformed into various nutrients after pyrolysis, which can be used for microbial nutritional metabolism [17]. Thirdly, biochar has a large specific surface area and therefore has a strong adsorption effect, which can enhance the absorption of nutrients in the soil and provide more nutrients for microorganisms. From the results of PCoA, it can be seen that the distance between applying phosphorus fertilizer alone or carbon phosphorus combination treatment and CK treatment is relatively far. Therefore, it can be concluded that adding biochar or phosphorus fertilizer can change the composition of bacterial communities. Previous studies have shown that biochar or phosphorus fertilizer can cause changes in bacterial community composition. The single application of phosphorus fertilizer is concentrated on one side, while the carbon phosphorus combination treatment is distributed on all sides. Perhaps this is because the application of biochar combined with phosphorus fertilizer changes the secretion of crop roots, leading to changes in the structure of bacterial communities [18]. In addition, this study found that the single application of phosphorus fertilizer and the low carbon combined application of low phosphorus treatment were relatively similar, which may be due to the fact that low amounts of biochar only promoted an increase in the relative abundance of individual bacterial groups, and therefore did not cause significant changes.
Effects of combined application of biochar and phosphate fertilizer on soil bacterial community composition
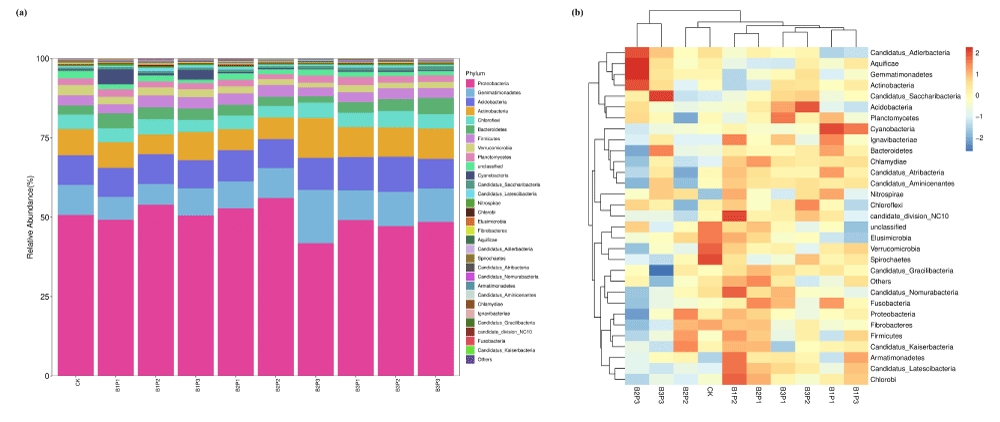
Figure 4 included the proportion of the top 10 bacterial phyla in soil bacteria taxa, and the relative abundance of the top 10 bacterial communities accounted for more than 94% of total soil bacteria in each group. At the phylum level, Proteobacteria, Acidobacteria, Gemmatimonadetes, Actinobacteria, Bacteroidetes, and Chloroflexi were dominant in the bacterial microbial community, and these 6 dominant phyla in each group covered 84.93%-88.77% of the overall microflora composition. The relative abundance of Bacteroidetes increased by 0.78% compared with the CK group. The relative abundance of Gemmatimonadetes was decreased by 1.15% on average compared with the CK group. On the whole, the abundance of Proteobacteria was increased by 2.68% compared with the CK group. High levels of biochar combined with phosphate fertilizer increased the relative abundance of Gemmatimonadetes and Actinobacteria and decreased the relative abundance of Acidobacteria. Compared with the CK group, the relative abundance of Gemmatimonadetes and Actinobacteria increased by 1.05% and 1.17%, respectively. The dominant bacterial phyla in each treatment group in this study are Proteobacteria, Acidobacteria, Actinobacteria, Bacteroidetes, Chloroflexi, and Gemmatimonadetes, which are consistent with the research results of Yao, et al. [19]. The application of phosphorus fertilizer alone increased the relative abundance of Actinobacteria and Bacteroidetes. Studies have shown that these two bacteria have the function of dissolving soil phosphorus and can convert difficult-to-use inorganic phosphorus and macromolecular organic phosphorus in the soil into phosphorus forms that can be absorbed and utilized by crops. Their relative abundance will increase with the application of phosphorus fertilizer [20]. Proteobacteria is the largest phylum of bacteria, with extremely strong survival ability and low requirements for survival conditions [21]. Yang, et al. [22] found that the combination of biochar and fertilizer can increase the relative abundance of Proteobacteria. In this study, the combination of low amounts of biochar and phosphorus fertilizer can increase the abundance of Proteobacteria. The application of high-carbon phosphorus fertilizer overall increased the relative abundance of Bacteroidetes, Actinobacteria, and Bacteroidetes, while reducing the relative abundance of Proteobacteria, Acidobacteria, and Chlorobacterium. After adding biochar, the soil is rich in nutrients, such as Proteobacteria and Actinobacteria, which can rapidly grow using effective carbon sources [23]. High amounts of biochar reduced the relative abundance of Proteobacteria, which may be due to the increase of harmful substances such as polycyclic aromatic hydrocarbons in soil caused by high amounts of biochar treatmen [24]. Acidobacteria and Chlorobacterium are considered to be oligotrophic bacteria with slow growth rates, appearing to be more likely to survive under nutrient-limited conditions [25]. The addition of biochar improved the nutrient status of the soil, although it did not reach an eutrophic state. Compared to the absence of biochar treatment, the soil environment changed and the growth of these bacteria was inhibited, Acidobacteria belongs to the acidophilic bacteria, and biochar improves soil acidity and alkalinity, thereby inhibiting the proliferation of Acidobacteria. The application of biochar combined with phosphorus fertilizer changed the nutrient requirements and habitat environment of these bacteria, thereby affecting their relative abundance.
Effects of combined application of biochar and phosphate fertilizer on the interaction network of soil bacteria
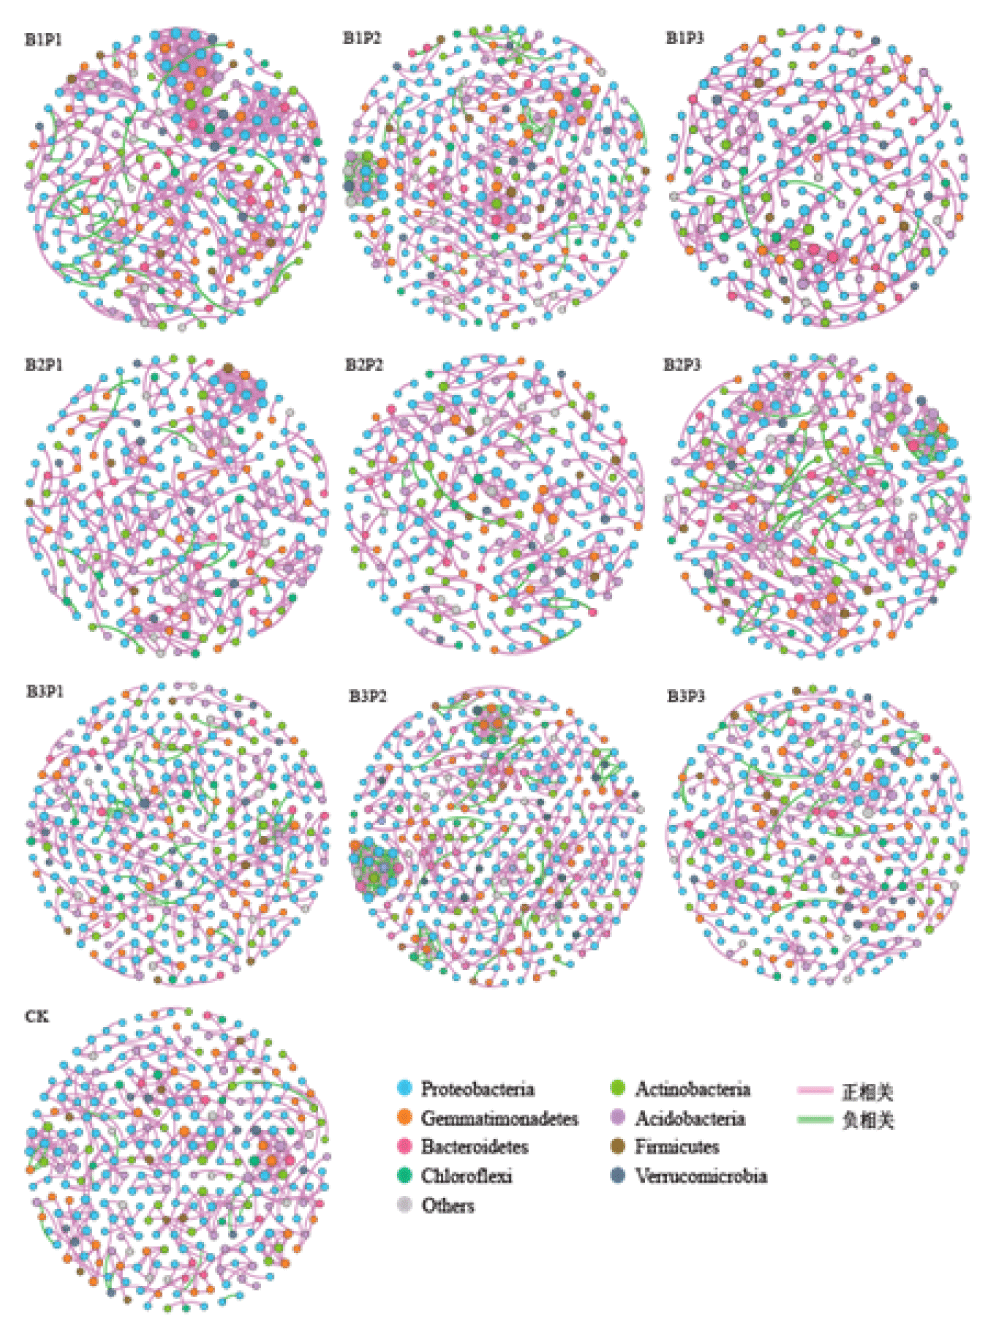
In order to explore the potential co-occurrence modes of soil bacteria under different biochar-phosphorus application conditions, the same threshold value (|r|>0.6, p < 0.01) was used in this study to construct a molecular ecological network for bacteria taxa structure (Figure 5). The topological characteristics of the bacterial interaction network are shown in Table 8. Nodes and edges could indicate the complexity of the network. The larger nodes displayed that more complex relationships existed among different phyla. The edges represented the relationship between doors, the red represented the positive correlation, and the green represented the negative correlation. No matter how the amounts of biochar and phosphate fertilizer were changed, the positive correlation ratio among the nodes of each treatment network was higher than the negative correlation ratio. The positive correlation between the co-occurrence network nodes of B1P3 and B2P2 treatment was greater than that of the CK group, while the negative correlation was lower than that of the CK group. Modularity and clustering coefficient reflected the degree of clustering between network nodes. The B1P1 application mode had the lowest degree of modularity at 0.864, while the other treatment strategy had modularity ranging from 0.933 to 0.972. The average clustering coefficient of different fertilization treatments was higher than that of the CK group, that is, a single application of phosphorus fertilizer or combined application of carbon and phosphorus could enhance the clustering degree of network nodes, and the average clustering coefficient of B2P2 treatment was the highest, with an increased trend of about 17.66% compared with CK group. Co-occurrence networks can indicate the interrelationships between species within soil microbial communities, providing new insights into the patterns of microbial abundance changes. The topological characteristics of the network can reflect the connectivity and interaction level between soil microorganisms. This study found that under low levels of biochar application, the number of nodes and connections in the network was lower than that of the CK treatment, while under high levels of biochar, the overall number of nodes was higher than that of the CK treatment. Among them, the number of nodes and connections in the B3P2 treatment was higher than that of the CK treatment, indicating that the combination of high levels of biochar and appropriate phosphorus fertilizer made the relationships between microbial species more complex, while low levels of biochar reduced the complexity of species relationships. The greater the negative correlation in the microbial interrelationship network, the stronger the antagonistic effect between species in the microbial community [26]. The application of biochar increased the negative correlation ratio in the microbial symbiotic network, which may be attributed to the increased inter-species antagonism level in soil bacterial communities and the intensity of selection stress within microbial communities treated with biochar combined with phosphorus fertilizer. Ratzke, et al. [27] pointed out that microorganisms often coexist in large quantities in low-nutrient environments, while sustained high nutrient supply leads to increased negative interactions between species. The application of biochar reduces the positive correlation ratio in the mutual network and increases the negative correlation ratio, which may be due to the increase in nutrient levels in the soil. Previous studies have shown that biochar can enhance the complexity of soil microbial communities, manifested by an increase in the number of nodes, connections, modularity, and average clustering coefficients in the interrelationship network [28]. Modularity is an inherent feature in microbial network relationships, which can reflect the interactions between microbial species, such as habitat heterogeneity, phylogenetic correlation, resource allocation, or niche overlap. Therefore, it plays an important role in the recovery ability and stability of microbial systems [29]. The modular structure of the interaction network of biochar combined with phosphorus fertilizer in this study is more complex, with many network nodes and interactions, and high network scores. The classification of microbial network modules does not necessarily follow taxonomy, that is, the interactions between microorganisms do not depend on their classification. Burke, et al. [30] found that there were significant differences in microbial composition among different samples, but their functional similarity could reach 70%, indicating that microbial assembly is determined by functional genes rather than species classification; the viewpoint was also proposed that species with similar nutrients and other ecological characteristics can occupy the same ecological niche. In this study, the addition of biochar redistributed ecological resources, which may be a possible reason for the modular changes in microbial networks.
Soil microbe biomarker screening
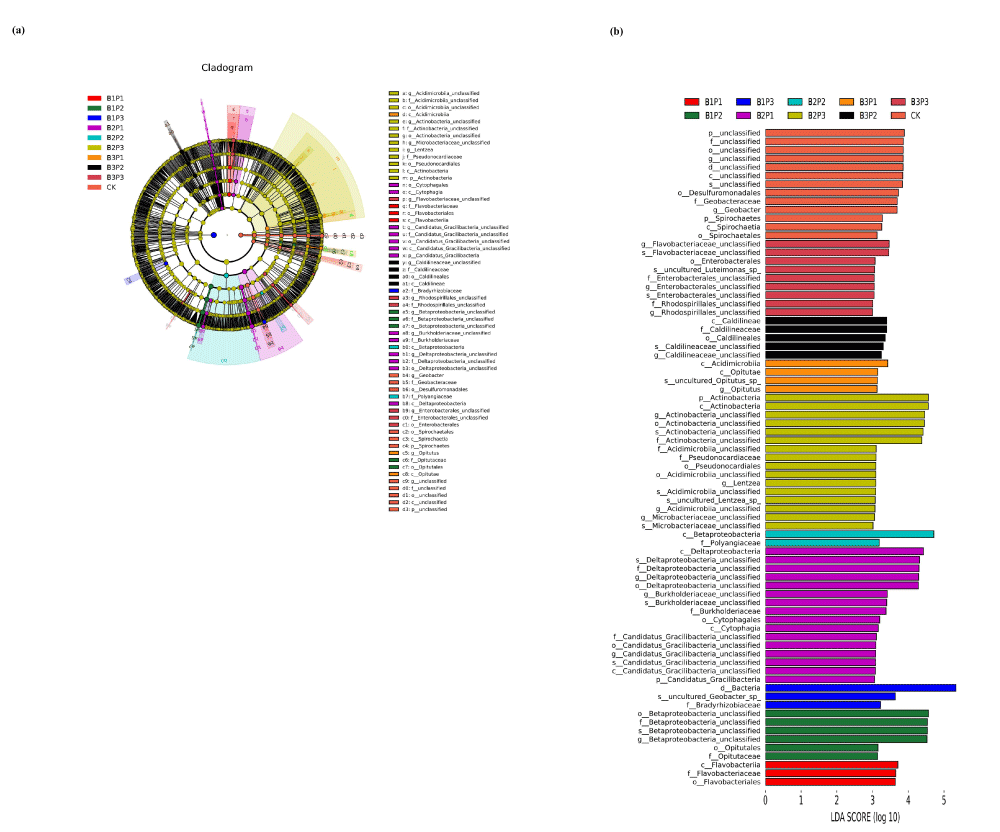
Linear discriminant analysis Effect Size (LEfSe) analysis (LDA>3, p < 0.05) was used for inter-group comparative analysis to identify these species with significant differences in the relative abundance of soil bacteria communities under different cultivate modes (Figure 6). LEfSe analysis showed that there were seventy-seven distinct bacterial populations, of which three were treated with B1P1, six with B1P2, three with B1P3, sixteen with B2P1, two with B2P2, sixteen with B3P1, four with B3P2, five with B3P2, nine with B3P3, and thirteen with CK. Detailed species taxa were described as follows. For phylum level, p__Spirochaetes, p__Actinobacteria, and p__Candidatus_Gracilibacteria. For class level, c__Spirochaetia, c__Actinobacteria and c__Acidimicrobiia. For order level, o__Betaproteobacteria_unclassified, o__Deltaproteobacteria_unclassified, o__Actinobacteria_unclassified and o__Desulfuromonadales. For family level, f__Betaproteobacteria_unclassified, f__Deltaproteobacteria_unclassified, f__Actinobacteria_unclassified, f__Geobacteraceae and f__Flavobacteriaceae. For genus level, g__Betaproteobacteria_unclassified, g__Deltaproteobacteria_unclassified, g__Actinobacteria_unclassified, unclassified and g__Geobacter. Above all, the combination of low or high phosphorus fertilizer with a low amount of biochar could increase the relative abundance of bacterial community differences, while the single phosphorus fertilizer or high level of biochar combined with phosphorus fertilizer would reduce the species’ number of differential bacteria taxa. LEfSe analysis was also used to identify marker species of microbial communities. Marker species participated in a series of ecological processes of microorganisms through transmission and liaison functions. LEfSe analysis results showed that there were significant differences in bacterial species abundance among different treatment modes. By changing the micro-environment of the rhizosphere soil and releasing chemical secretions (supplement or discharge), different biochar and phosphate fertilizer treatments could establish a suitable rhizosphere growth environment, thus accelerating the selection of rhizosphere microbial communities [31], resulting in differences in marker species among different treatments. Most of the important microbial markers belong to the bacterial groups Actinomycetes and Proteobacteria. Our results were consistent with the conclusions proposed by Zhang, et al. [32]. Based on the LEfSe of bacteria, the main biomarker species in the combined application of carbon and phosphorus were Actinobacteria, Spirochaetes, Acidimicrobiia, Betaproteobacteria, Deltaproteobacteria, Caldilineae, Opitutae and Cytophagia, suggesting that the co-application of biochar and phosphate fertilizer might change the community structure and composition of rhizosphere microorganisms, thereby affecting a variety of biological processes [33]. Actinobacteria, Spirochaetes, Acidimicrobiia, and Betaproteobacteria played important roles in the biochemistry cycle of soil carbon and were suitable for the conversion of various carbon sources, especially the hard-to-use carbon in biochar [34]. It may also be the reason for the presence of these markers in the soil treated with biochar and phosphate fertilizer.
Relationship between soil bacterial community and physicochemical properties
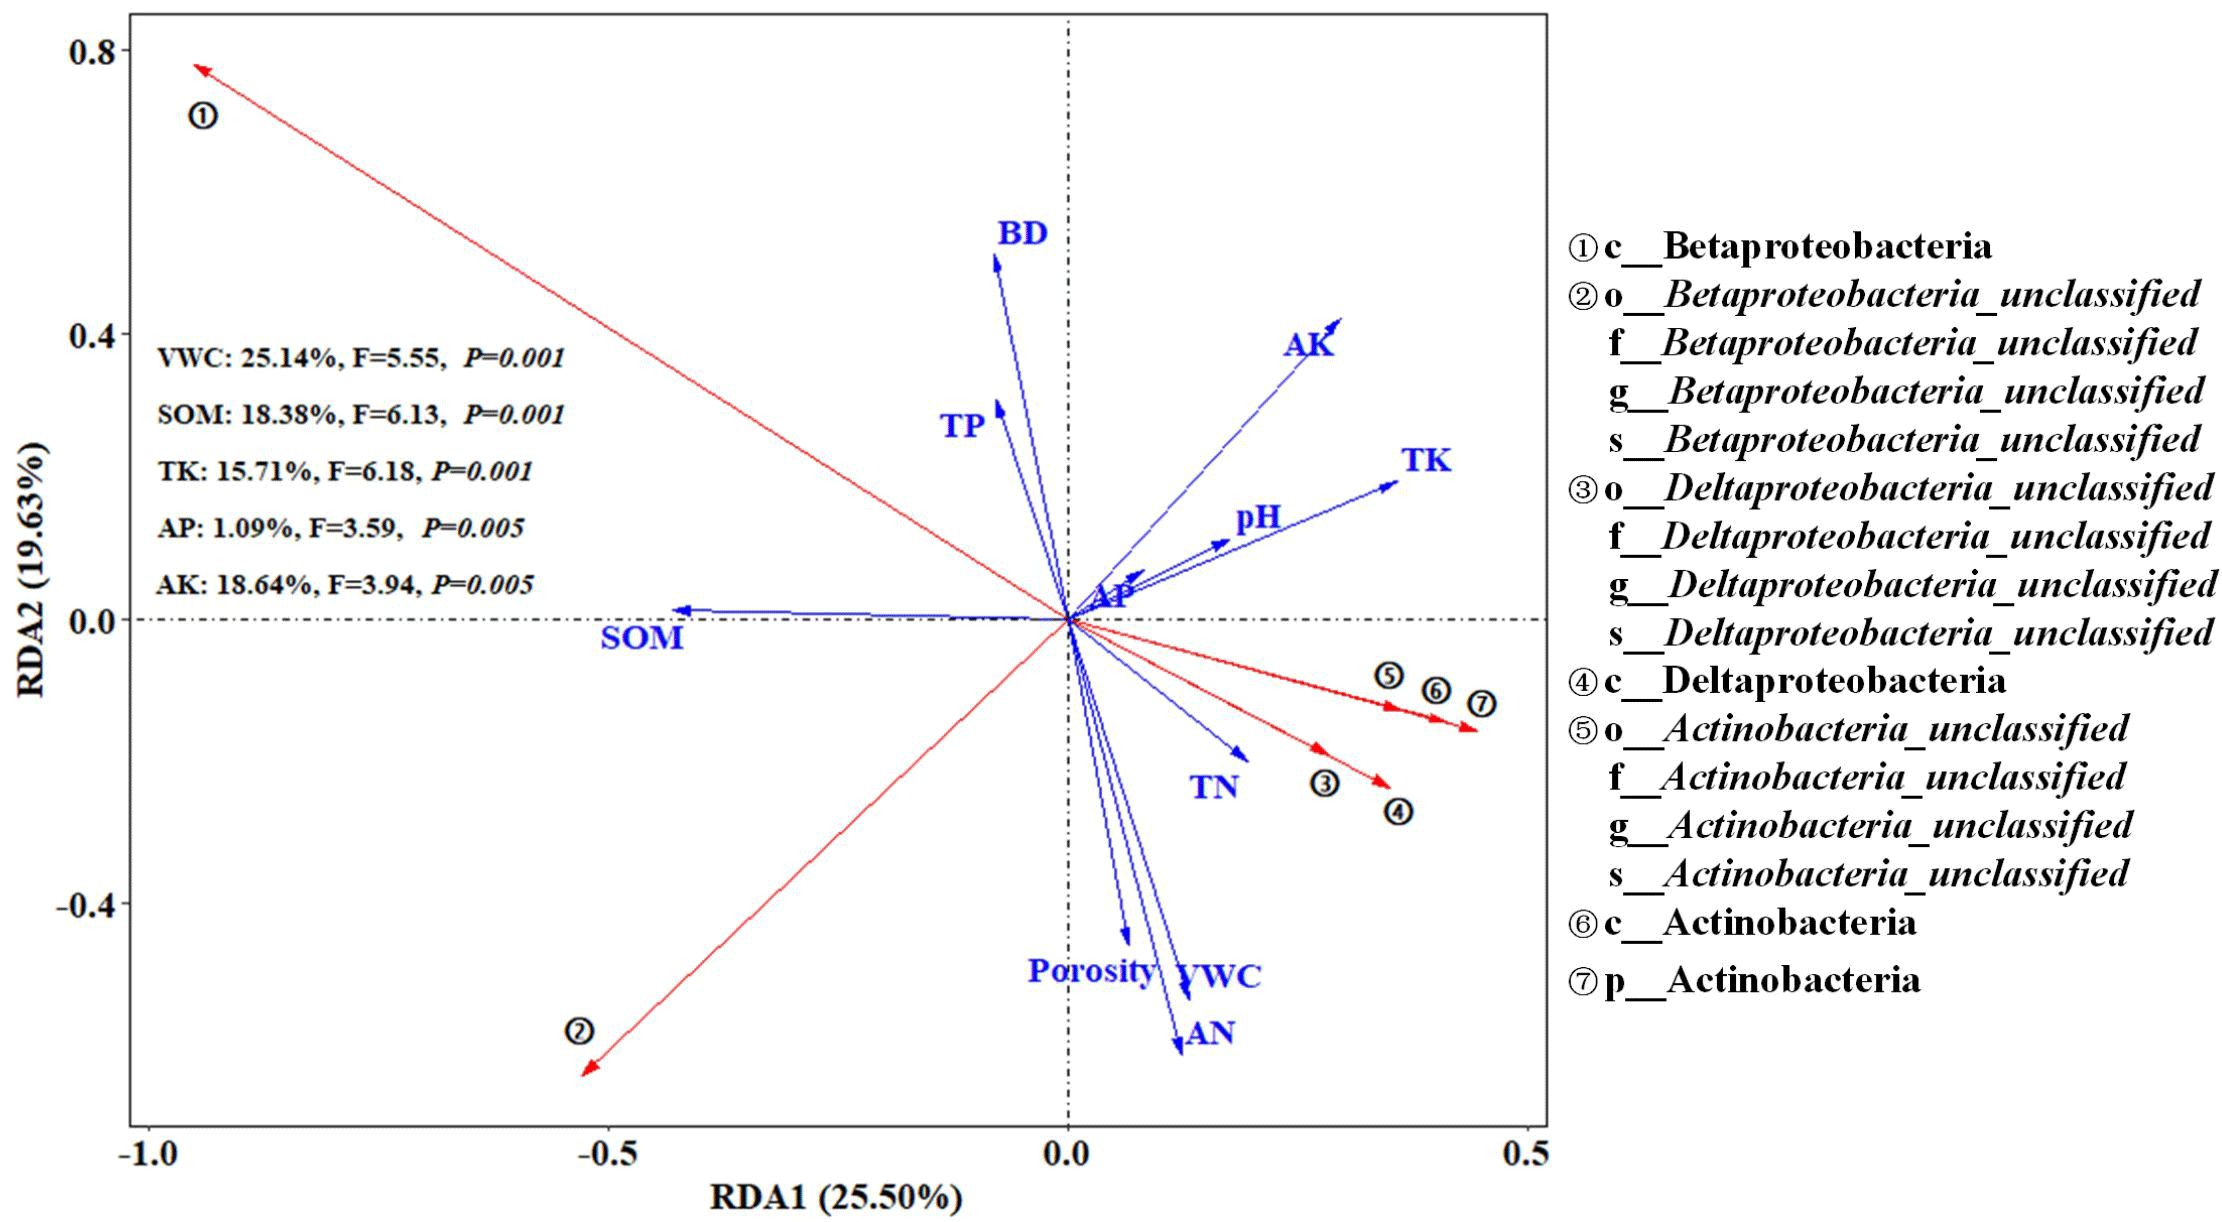
Species taxa with LDA>4 were selected as the keystone species of the bacterial community. Redundancy analysis (RDA) for the relationship between the key species in soil bacterial community and soil physical-chemical properties showed that the RDA1 axis and RDA2 axis explained 25.50% and 19.63% of the variation trend of critical soil bacterial taxa, respectively (Figure 7). p_Actinobacteria was positively correlated with pH value and available phosphorus while o_Betaproteobacteria_unclassified, f_Betaproteobacteria_unclassified, and g_Betaproteobacteria_unclassified were negatively correlated with pH value and available potassium. c_Betaproteobacteria was positively correlated with soil organic matter and total phosphorus. c_Deltaproteobacteria, o_Deltaproteobacteria_unclassified, f_Deltaproteobacteria_unclassified, and g_Deltaproteobacteria_unclassified were negatively correlated with bulk density and positively correlated with soil total nitrogen, total potassium, water content and alkali-hydrolyzed nitrogen. As shown in Figure 7, soil water content, organic matter, total potassium, available phosphorus, and available potassium had significant effects on the changes of marker species of soil bacteria community, in which water content, organic matter, total potassium, and available potassium contributed the most to the alteration in the bacteria community structures. The bacteria in soil microorganisms had a great influence on the decomposition, transformation, and circulation of soil substances. The soil bacteria community is closely related to the soil’s physical and chemical properties. This study analyzed the correlation between soil bacterial key species and soil physical and chemical properties. According to the results of redundancy analysis, water content, organic matter, total potassium, available phosphorus, and available potassium were the main physicochemical factors affecting the key species of soil bacteria. Soil potassium is essential for the growth of soil microorganisms and has been reported as an important factor that would affect soil bacterial communities [35]. In this study, p__Actinobacteria, c__Actinobacteria, o__Actinobacteria_unclassified, f__Actinobacteria_unclassified and s__Actinobacteria_unclassified is positively correlated with total potassium, o__Betaproteobacteria_unclassified, f__Betaproteobacteria_unclassified, g__Betaproteobacteria_unclassified, and s__Betaproteobacteria_unclassified were negatively correlated with available potassium, which is similar to the results of Yang, et al. [22]. In addition, p__Actinobacteria was positively correlated with soil-available phosphorus, which is consistent with previous studies [27]. Betaproteobacteria plays an important role in the carbon and nitrogen cycle [36] and is positively correlated with soil organic matter and total phosphorus. c__Deltaproteobacteria, o__Deltaproteobacteria_unclassified, and f__Deltaproteobacteria_unclassified were significantly positively correlated with soil water content and porosity. As an important part of soil structure, porosity has a positive effect on the conduction of water and air in soil, which is conducive to the growth and reproduction of aerobic bacteria. Soil water content is one of the main factors to maintain soil microbial life activities [37]. These bacterial keystone species may be involved in the soil nutrient cycling process. In conclusion, the combined application of biochar and phosphate fertilizer affects the physical and chemical properties of soil and thus affects the diversity and community structure of soil microorganisms. The reason may be that the excellent pore size and specific surface area of biochar can improve the pore structure of the soil, thus creating an aerobic environment and affecting the living space of bacteria, which is conducive to the growth and reproduction of the soil microbial community. In addition, biochar, through its mineralization, subsequently releases unstable carbon and nitrogen, which improves the activity of related enzymes in soil, thereby improving the nutrient status of soil, and thus affecting the growth, activity, and diversity of microorganisms [13].
Analysis of the driving factors of yield under the combined application of biochar-phosphorus fertilizer
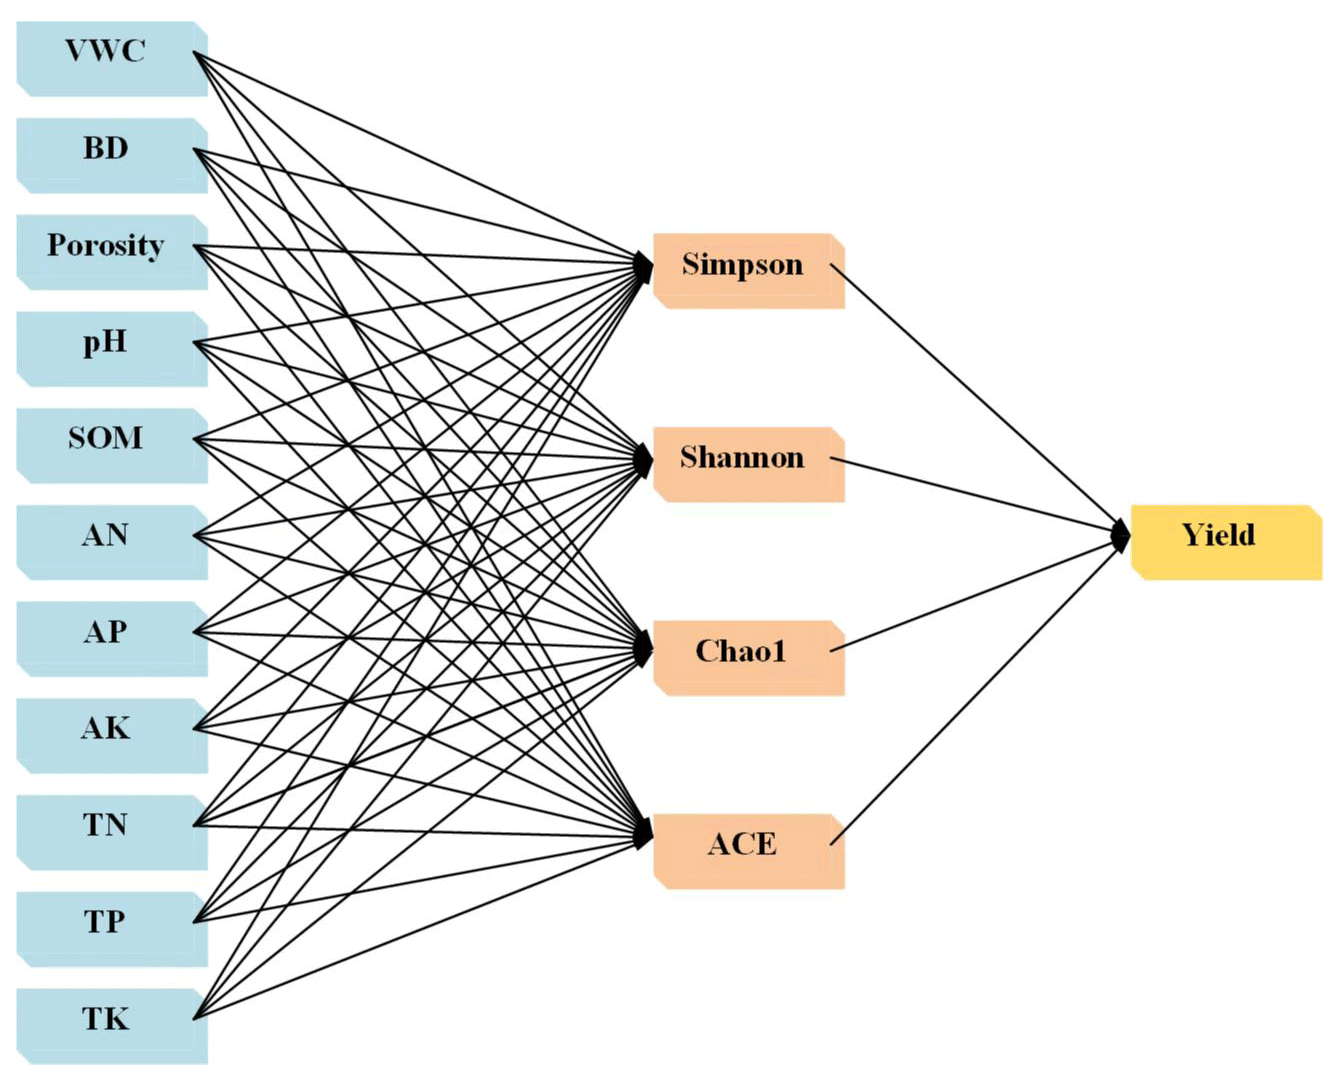
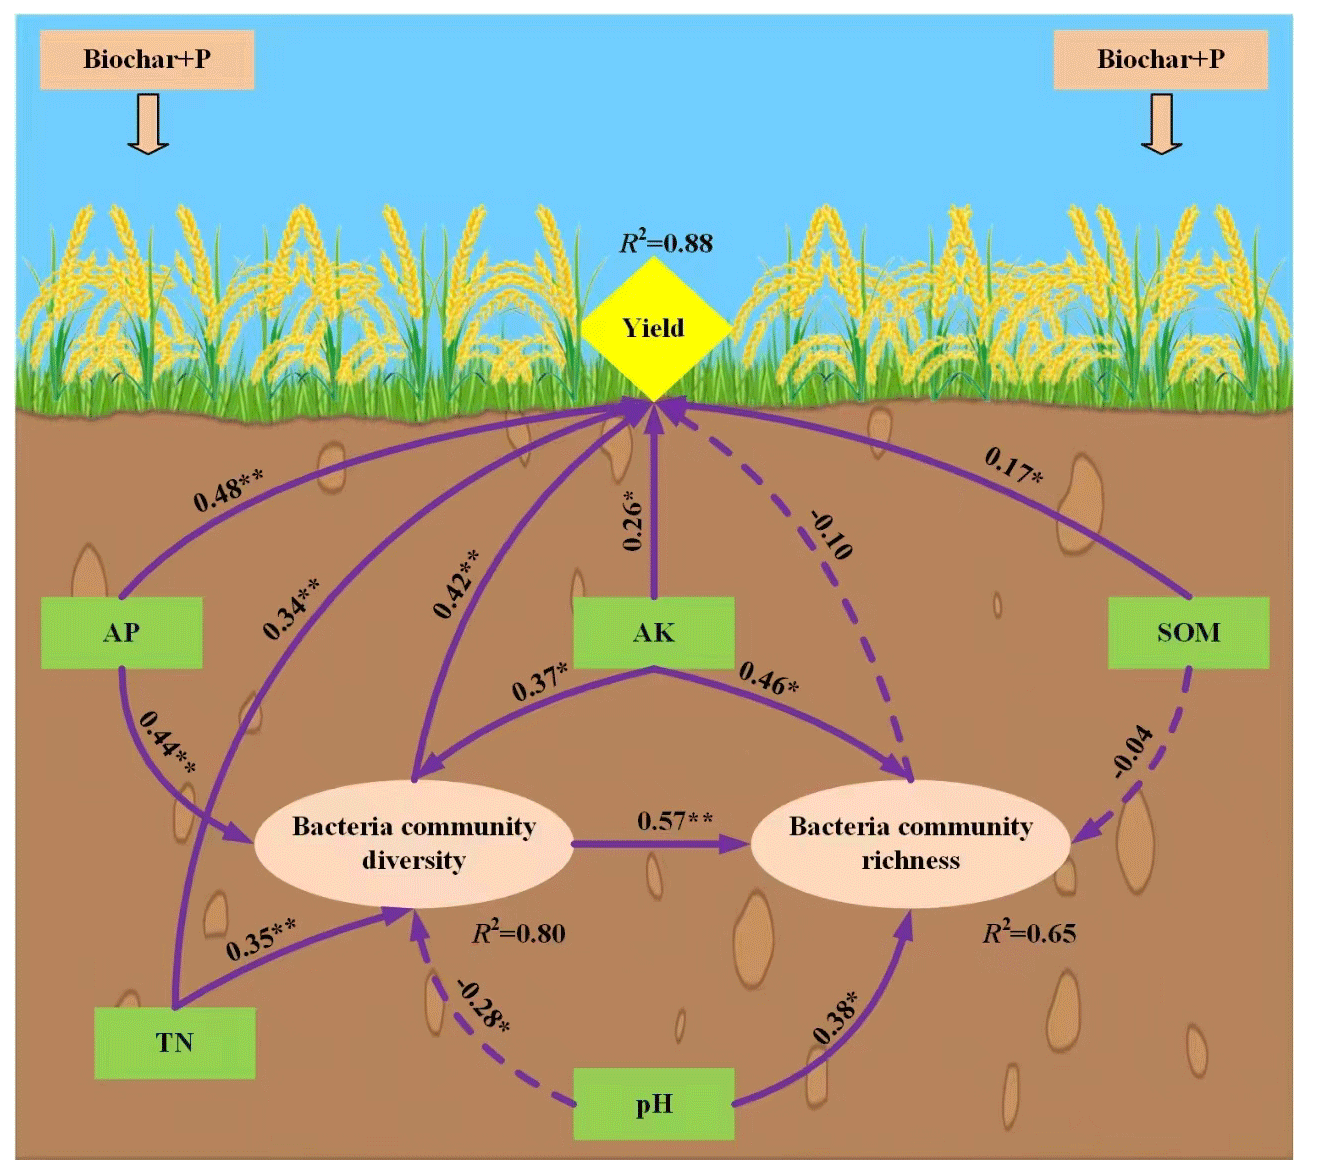
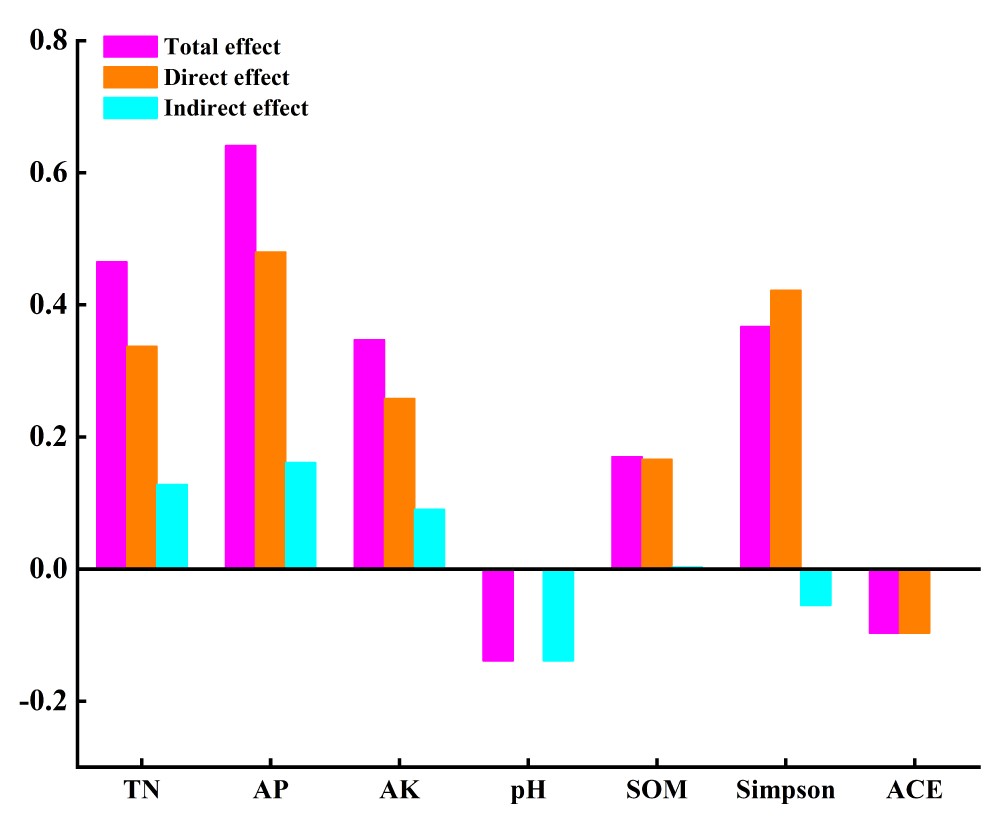
In order to study the driving factors that could affect the rice yield after combined application for biochar and phosphorus fertilizer, soil physicochemical properties (water content, bulk density, porosity, pH value, organic matter, total nitrogen, total phosphorus, total potassium, alkali-hydrolyzed nitrogen, available phosphorus, and available potassium) were regarded as external variables. With the α diversity of bacteria as the intermediate variables and rice yield as the internal variables, the initial Structural Equation Model (SEM) among soil physicochemical properties-bacteria community-rice yield under the combined application for biochar and phosphate fertilizer (Figure 8). In the output results of the initial SEM constructed by Amos software, the fitting index could be obtained and each index reflected different fitting effects. In our results, all the fitness indicators of the model met the requirements after several revisions. Table 9 listed the fitness indicators and the results showed that the model fitted in a better status. The comprehensive response effects of soil nutrient content and bacterial community diversity to rice yield were analyzed by modified SEM. The effects of the combined application of biochar and phosphate fertilizer on rice yield were mainly caused by the changes in soil nutrients and bacterial community with a total variance of 88% (Figure 9). Soil organic matter, total nitrogen, available phosphorus, and available potassium could directly affect the rice yield. In addition, bacteria community richness was directly regulated by bacterial community diversity (path coefficient = 0.57). Under the combined application of organic and inorganic fertilizers, the direct driving factor that had the greatest effect on rice yield was the available phosphorus (path coefficient =0.48). At the same time, soil available phosphorus, pH value, total nitrogen, and available potassium could affect the bacteria community diversity, which could change the potential impacts of soil microorganisms in the carbon-nitrogen-phosphorus cycling process. Therefore, it indirectly regulated the soil nutrient conversion process and ultimately affected the final rice yield. The order for the driving factors was described as follows: soil available phosphorus, total nitrogen, available potassium, organic matter, and pH value (Figure 10). The effects of the combined application of biochar and phosphorus fertilizer on rice yield were complicated, and related to the types and amounts of biochar and phosphorus fertilizer, soil types, soil physicochemical properties, and microbial communities. In this study, the direct or indirect effects of each index on rice yield were quantitatively analyzed by constructing a structural equation model based on soil nutrient, bacterial community, and rice yield under the combined application of biochar and phosphate fertilizer. The total explanations of bacterial community diversity, bacterial community richness, and rice yield were 80.1%, 64.5%, and 87.5%, respectively. The results showed that rice yield was affected by multiple factors. Some studies have suggested that soil physical and chemical properties strongly affect soil microbial communities [38]. The results showed that soil pH, organic matter, total nitrogen, available phosphorus, and available potassium could indirectly or directly affect rice yield by driving the diversity and richness of bacterial community structure, among which soil available phosphorus, total nitrogen, and available potassium had the greatest driving effect on rice yield. The effects of the combined application of biochar and phosphorus fertilizer on rice yield were complicated, and related to the types and amounts of biochar and phosphorus fertilizer, soil types, soil physicochemical properties, and microbial communities. In this study, the direct or indirect effects of each index on rice yield were quantitatively analyzed by constructing a structural equation model based on soil nutrient, bacterial community, and rice yield under the combined application of biochar and phosphate fertilizer. The total explanations of bacterial community diversity, bacterial community richness, and rice yield were 80.1%, 64.5%, and 87.5%, respectively. The results showed that rice yield was affected by multiple factors. Some studies have suggested that soil physical and chemical properties strongly affect soil microbial communities [38]. The results showed that soil pH, organic matter, total nitrogen, available phosphorus, and available potassium could indirectly or directly affect rice yield by driving the diversity and richness of bacterial community structure, among which soil available phosphorus, total nitrogen, and available potassium had the greatest driving effect on rice yield (Figure 10). Studies have also shown that nutrient availability can limit soil microbial activity in rice ecosystems [39]. The results of this experiment show that available phosphorus can directly regulate rice yield and indirectly affect rice yield through soil bacterial diversity (Figure 10), which may be because the availability of phosphorus in soil is a major limiting factor for microbial growth and crop yield [40]. When phosphorus fertilizer is added to the soil, it provides phosphorus for the soil, and biochar acts on the inorganic phosphorus in the soil because of its strong resistance to decomposition and oxidation, thus improving the availability of phosphorus in the soil. At the same time, when biochar is applied to soil, it can increase the content of available phosphorus in the soil through concentration gradient diffusion, and the increase of available phosphorus promotes the growth of crops. In addition, with the increase of available phosphorus content, the activity of some important phosphorus-soluble bacteria in the soil was promoted [41], and the structure of the soil bacterial community was changed, thus affecting the growth of crops. In this experiment, total nitrogen can directly regulate rice yield, but also indirectly drive bacterial diversity and thus affect rice yield. Biochar increases the nitrogen content in the soil, promotes the accumulation of above-ground and subsurface biomass, and thus affects the nutrient conversion of soil microorganisms [42]. Soil organic matter and pH are considered to be important drivers of terrestrial ecosystem function [38]. These results indicate that soil organic matter can affect rice yield by directly changing the abundance of bacterial communities, possibly because the active microbial communities are susceptible to the availability of organic matter [43]. In addition to affecting rice yield through bacterial diversity, soil pH also indirectly drives bacterial abundance through affecting bacterial diversity, thus affecting rice yield. Therefore, the combination of biochar and phosphate fertilizer can not only directly promote the formation of rice yield by regulating soil nutrient availability and pH, but also indirectly affect the diversity and abundance of microbial community to regulate rice yield. However, the present study was only performed based on the pot experiment and proposed that the co-application of biochar and phosphate fertilizer could affect the soil microbe community composition. In the future, it was essential to develop field experiments to simulate the natural crop culture production environment. With the rapid development of genome technology, it was thought that functional genome sequencing was needed to clarify the molecular mechanism in the regulation roles of biochar-phosphate fertilizer on the soil microorganism and crop field.
Conclusion
Biochar combined with phosphorus fertilizer had a certain effect on soil bacterial community diversity and altered the bacteria taxa composition in the soil ecology system. The relationships among species of bacteria community in each treatment were mainly positive. The combination of biochar and phosphate fertilizer strengthened the competition among species in the bacteria symbiotic network, reduced the complexity and separation degree of the soil bacteria community system, and increased the connectivity of microbe taxa structure. It was also found that water content, organic matter, total potassium, available phosphorus, and quick-acting potassium were the main physical and chemical factors affecting soil bacteria community structure.
This work was supported by the Heilongjiang Province Postdoctoral Fund Project (LBH-Z17017) and the Development Project of the Key Laboratory for Efficient Utilization of Agricultural Water Resources of the Ministry of Agriculture and Rural Affairs (2017009). The study was supported by the Experimental Center of the School of Water Resources and Civil Engineering, Northeast Agricultural University. All authors would thank Lian Chuan-Biotechnology Co., Ltd. (Hangzhou, China) for their assistance during the raw sequencing data analysis. Acknowledgments to AJE company for their help in editing the language of this paper.
Conflict of interest
None of the authors have any financial or personal relationships that could inappropriately influence or bias the content of the paper.
Author contributions
Yutao Li Writing-original draft, Methodology, Investigation, Formal analysis, Data curation. Hui Liu: Supervision, Writing-review & editing, Project administration, Funding acquisition. All authors read and approved the final manuscript.
Data availability
Original data used and generated in this study are available from the corresponding authors on request with a completed Data Transfer Agreement.
- Kaur T, Devi R, Kour D, Yadav A, Yadav AN, Dikilitas M, et al. Plant growth promoting soil microbiomes and their potential implications for agricultural and environmental sustainability. Biologia. 2021;76(12):2687-2709. Available from: http://dx.doi.org/10.1007/s11756-021-00806-w
- Schloss PD, Handelsman J. Toward a census of bacteria in soil. PLoS Comput Biol. 2006;2(7):786-793. Available from: https://doi.org/10.1371/journal.pcbi.0020092
- Thiele-Bruhn S, Bloem J, de Vries FT, Kalbitz K, Wagg C. Linking soil biodiversity and agricultural soil management. Curr Opin Environ Sustain. 2012;4(5):523-528. Available from: https://doi.org/10.1016/j.cosust.2012.06.004
- Dangi SR, Banuelos G, Buyer JS, Hanson B, Gerik J. Microbial community biomass and structure in saline and non-saline soils associated with salt- and boron-tolerant poplar clones grown for the phytoremediation of selenium. Int J Phytoremediation. 2018;20(2):129-137. Available from: https://doi.org/10.1080/15226514.2017.1337073
- Stone D, Costa D, Daniell TJ, Mitchell SM, Topp CFE, Griffiths BS. Using nematode communities to test a European scale soil biological monitoring programme for policy development. Appl Soil Ecol. 2016;97:78-85. Available from: https://doi.org/10.1016/j.apsoil.2015.08.017
- Manya JJ. Pyrolysis for biochar purposes: A review to establish current knowledge gaps and research needs. Environ Sci Technol. 2012;46(15):7939-7954. Available from: https://doi.org/10.1021/es301029g
- El-Nagar DA, Abdel-Halim KY. Remediation of heavy metals in contaminated soil by using nano-bentonite, nano-hydroxyapatite, and nano-composite. Land Degrad Dev. 2021;32(14):4562-4573. Available from: http://dx.doi.org/10.1002/ldr.4052
- Hota S, Mishra VK, Mourya KK, Giri K, Kumar D, Jha PK, et al. Land use, landform, and soil management as determinants of soil physicochemical properties and microbial abundance of lower Brahmaputra valley, India. Sustainability. 2022;14(4):2241. Available from: https://doi.org/10.3390/su14042241
- Iqbal H, Garcia-Perez M, Flury M. Effect of biochar on leaching of organic carbon, nitrogen, and phosphorus from compost in bioretention systems. Sci Total Environ. 2015;521:37-45. Available from: https://doi.org/10.1016/j.scitotenv.2015.03.060
- Zhang H, Wang S, Zhang J, Tian C, Luo S. Biochar application enhances microbial interactions in mega-aggregates of farmland black soil. Soil Tillage Res. 2021;213 . Available from: https://doi.org/10.1016/j.still.2021.105145
- Zhu X, Chen B, Zhu L, Xing B. Effects and mechanisms of biochar-microbe interactions in soil improvement and pollution remediation: A review. Environ Pollut. 2017;227:98-115. Available from: https://doi.org/10.1016/j.envpol.2017.04.032
- Samaddar S, Chatterjee P, Truu J, Anandham R, Kim S, Sa T. Long-term phosphorus limitation changes the bacterial community structure and functioning in paddy soils. Appl Soil Ecol. 2019;134:111-115. Available from: https://doi.org/10.1016/j.apsoil.2018.10.016
- Amoakwah E, Arthur E, Frimpong KA, Lorenz N, Rahman MA, Nziguheba G, et al. Biochar amendment impacts on microbial community structures and biological and enzyme activities in a weathered tropical sandy loam. Appl Soil Ecol. 2022;104364. Available from: http://dx.doi.org/10.1016/j.apsoil.2021.104364
- Yaashikaa PR, Kumar PS, Saravanan A, Vo D-VN. Advances in biosorbents for removal of environmental pollutants: A review on pretreatment, removal mechanism and future outlook. J Hazard Mater. 2021; 420:126596. Available from: https://doi.org/10.1016/j.jhazmat.2021.126596
- Yan T, Xue J, Zhou Z, Wu Y. Biochar-based fertilizer amendments improve the soil microbial community structure in a karst mountainous area. Sci Total Environ. 2021;794:148757. Available from: https://doi.org/10.1016/j.scitotenv.2021.148757
- Lehmann J, Rillig MC, Thies J, Masiello CA, Hockaday WC, Crowley D. Biochar effects on soil biota - A review. Soil Biol Biochem. 2011;43(9):1812-1836. Available from: https://doi.org/10.1016/j.soilbio.2011.04.022
- Godlewska P, Josko I, Oleszczuk P. Ecotoxicity of sewage sludge- or sewage sludge/willow-derived biochar-amended soil. Environ Pollut. 2022;305: 119235. Available from: https://doi.org/10.1016/j.envpol.2022.119235
- Wu L, Wang J, Huang W, Wu H, Chen J, Yang Y, et al. Plant-microbe rhizosphere interactions mediated by Rehmannia glutinosa root exudates under consecutive monoculture. Sci Rep. 2016;6:15871. Available from: https://www.nature.com/articles/srep15871
- Yao Q, Liu J, Yu Z, Li Y, Jin J, et al. Changes of bacterial community compositions after three years of biochar application in a black soil of northeast China. Appl Soil Ecol. 2017;113:11-21. Available from: http://dx.doi.org/10.1016/j.apsoil.2017.01.007
- Sun L, Zhao X, Zhang H, Zhang Y. Biological characteristics of a denitrifying phosphorus-accumulating bacterium. Ecol Eng. 2015;81:82-88. Available from: http://dx.doi.org/10.1016/j.ecoleng.2015.04.030
- Rampelotto PH, Ferreira AdS, Muller Barboza AD, Wurdig Roesch LF. Changes in diversity, abundance, and structure of soil bacterial communities in Brazilian savanna under different land use systems. Microb Ecol. 2013;66(3):593-607. Available from: https://doi.org/10.1007/s00248-013-0235-y
- Yang W, Li C, Wang S, Zhou B, Mao Y, Rensing C, et al. Influence of biochar and biochar-based fertilizer on yield, quality of tea and microbial community in an acid tea orchard soil. Appl Soil Ecol. 2021;166:104005. Available from: https://doi.org/10.1016/j.apsoil.2021.104005
- Zeng J, Liu X, Song L, Lin X, Zhang H, Shen C, et al. Nitrogen fertilization directly affects soil bacterial diversity and indirectly affects bacterial community composition. Soil Biol Biochem. 2016;92:41-49. Available from: http://dx.doi.org/10.1016/j.soilbio.2015.09.018
- Hale SE, Lehmann J, Rutherford D, Zimmerman AR, Bachmann RT, Shitumbanuma V, et al. Quantifying the total and bioavailable polycyclic aromatic hydrocarbons and dioxins in biochars. Environ Sci Technol. 2012;46(5):2830-2838. Available from: https://doi.org/10.1021/es203984k
- Naether A, Foesel BU, Naegele V, Wuest PK, Weinert J, Bonkowski M, et al. Environmental factors affect Acidobacterial communities below the subgroup level in grassland and forest soils. Appl Environ Microbiol. 2012;78(21):7398-7406. Available from: https://doi.org/10.1128/AEM.01325-12
- Lin Y, Ye G, Kuzyakov Y, Liu D, Fan J, Ding W. Long-term manure application increases soil organic matter and aggregation, and alters microbial community structure and keystone taxa. Soil Biol Biochem. 2019;134:187-196. Available from: https://doi.org/10.1016/j.soilbio.2019.03.030
- Ratzke C, Barrere J, Gore J. Strength of species interactions determines biodiversity and stability in microbial communities. Nat Ecol Evol. 2020;4(3):376-383. Available from: https://www.nature.com/articles/s41559-020-1099-4
- Zhou Z, Gao T, Zhu Q, Yan T, Li D, Xue J, et al. Increases in bacterial community network complexity induced by biochar-based fertilizer amendments to karst calcareous soil. Geoderma. 2019;337:691-700. Available from: https://doi.org/10.1016/j.geoderma.2018.10.013
- Olesen JM, Bascompte J, Dupont YL, Jordano P. The modularity of pollination networks. Proc Natl Acad Sci U S A. 2007;104(50):19891-19896. Available from: https://doi.org/10.1073/pnas.0706375104
- Burke C, Steinberg P, Rusch D, Kjelleberg S, Thomas T. Bacterial community assembly based on functional genes rather than species. Proc Natl Acad Sci U S A. 2011;108(37):14288-14293. Available from: https://doi.org/10.1073/pnas.1101591108
- Liu Y, Yang H, Liu Q, Zhao X, Xie S, Wang Z, et al. Effect of two different sugarcane cultivars on rhizosphere bacterial communities of sugarcane and soybean upon intercropping. Front Microbiol. 2021;11. Available from: https://doi.org/10.3389/fmicb.2020.596472
- Zhang Q, Guo T, Li H, Wang Y, Zhou W. Identification of fungal populations assimilating rice root residue-derived carbon by DNA stable-isotope probing. Appl Soil Ecol. 2020;147:103374. Available from: https://doi.org/10.1016/j.apsoil.2019.103374
- Zhang F, Huo Y, Cobb AB, Luo G, Zhou J, Yang G, et al. Trichoderma biofertilizer links to altered soil chemistry, altered microbial communities, and improved grassland biomass. Front Microbiol. 2018;9:848. Available from: https://doi.org/10.3389/fmicb.2018.00848
- Fan M, Lal R, Cao J, Qiao L, Su Y, Jiang R, et al. Plant-based assessment of inherent soil productivity and contributions to China's cereal crop yield increase since 1980. PLoS One. 2013;8(9). Available from: https://doi.org/10.1371/journal.pone.0074617
- Hamidovic S, Cvijovic G, Waisi H, Zivotic L, Soja SJ, Raicevic V, et al. Response of microbial community composition in soils affected by coal mine exploitation. Environ Monit Assess. 2020;192(4):364.
- Spain AM, Krumholz LR, Elshahed MS. Abundance, composition, diversity and novelty of soil Proteobacteria. ISME J. 2009;3(8):992-1000. Available from: https://doi.org/10.1038/ismej.2009.43
- Clark JS, Campbell JH, Grizzle H, Acosta-Martinez V, Zak JC. Soil microbial community response to drought and precipitation variability in the Chihuahuan Desert. Microb Ecol. 2009;57(2):248-260. Available from: https://link.springer.com/article/10.1007/s00248-008-9475-7
- Delgado-Baquerizo M, Maestre FT, Reich PB, Jeffries TC, Gaitan JJ, Encinar D, et al. Microbial diversity drives multifunctionality in terrestrial ecosystems. Nat Commun. 2016;7:10541. Available from: https://www.nature.com/articles/ncomms10541
- Wei XM, Zhu ZK, Wei L, Wu JS, Ge T. Biogeochemical cycles of key elements in the paddy-rice rhizosphere: Microbial mechanisms and coupling processes. Rhizosphere. 2019;10:100130. Available from: https://doi.org/10.1016/j.rhisph.2019.100145
- Peñuelas J, Poulter B, Sardans J, Ciais P, van der Velde M, Bopp L, et al. Human-induced nitrogen-phosphorus imbalances alter natural and managed ecosystems across the globe. Nat Commun. 2013;4:2934. Available from: https://www.nature.com/articles/ncomms3934
- Soumare A, Boubekri K, Lyamlouli K, Hafidi M, Ouhdouch Y, Kouisni L. Efficacy of phosphate solubilizing Actinobacteria to improve rock phosphate agronomic effectiveness and plant growth promotion. Rhizosphere. 2021;17:100284. Available from: https://doi.org/10.1016/j.rhisph.2020.100284
- Zheng Q, Hu YT, Zhang SS, Noll L, Böckle T, Richter A, et al. Growth explains microbial carbon use efficiency across soils differing in land use and geology. Soil Biol Biochem. 2019;128:45-55. Available from: https://doi.org/10.1016/j.soilbio.2018.10.006
- Bastida F, Torres IF, Moreno JL, Baldrian P, Ondoño S, Ruiz-Navarro A, et al. The active microbial diversity drives ecosystem multifunctionality and is physiologically related to carbon availability in Mediterranean semi-arid soils. Mol Ecol. 2016;25(19):4660-4673. Available from: https://doi.org/10.1111/mec.13783
Article Alerts
Subscribe to our articles alerts and stay tuned.
 This work is licensed under a Creative Commons Attribution 4.0 International License.


 Save to Mendeley
